

If your organization is employing a SharePoint platform, analyzing and tracking activity is critical. Knowing where your visitors are coming from, what days they’re coming most frequently, and how long they’re staying are just a few of the most important insights you can use to help improve your portal and inform your decision making.
If you’re currently employing SharePoint Analytics to monitor your platform, we have great news for you.
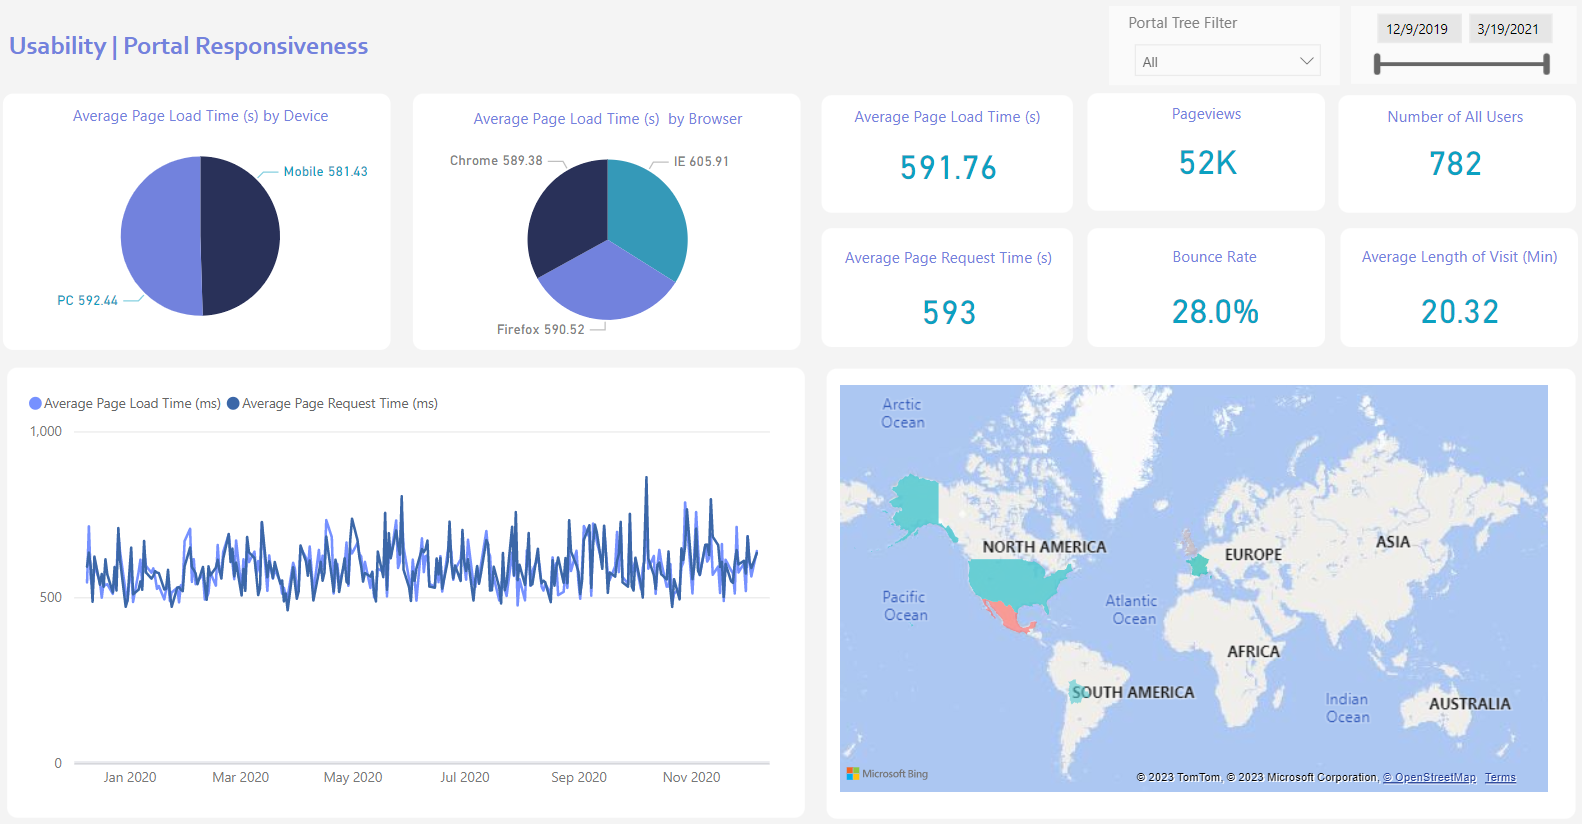
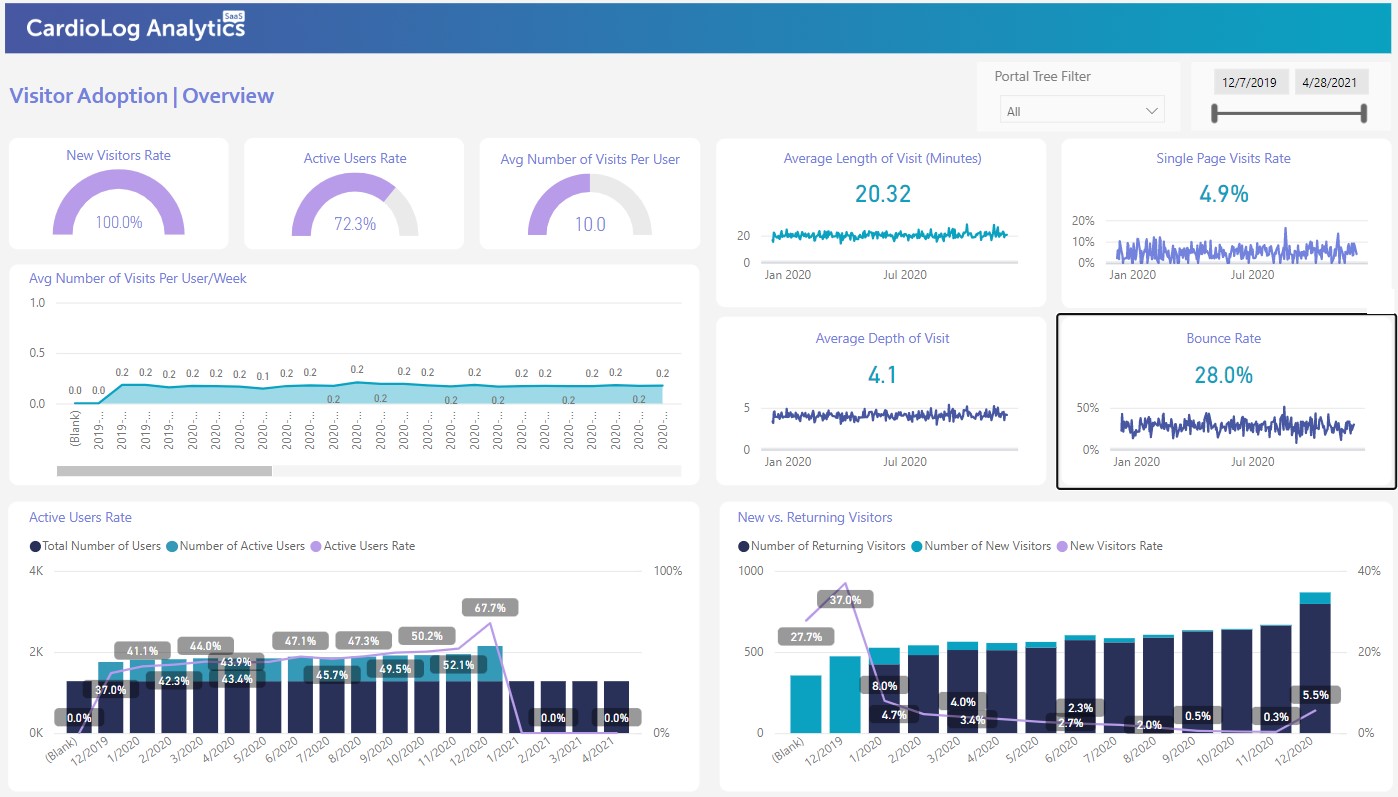
Now you can use Microsoft Power BI to monitor, explore, and visualize your CardioLog Analytics data. By viewing CardioLog data through live, interactive dashboards, you can view your data simply and at ease. If you’re a stakeholder or administrator, you can now have a holistic view of your business activity all in one easy glance. You now have access to convenient accessibility and user-friendly dashboards thanks to the integration of these two advanced solutions.
With POWER BI, you can view dozens of reporting choices, so you can monitor the KPIs that matter most.
Here’s a preview of what you have to look forward to with our newest integration with Power BI.
For more information on the CardioLog Analytics-Power BI offering, click below:
- Introduction to CardioLog Analytics and Microsoft Power BI
- On Premises and SharePoint Reports Embedded for Power BI
- Cloud-Based CardioLog/Power BI
- Hybrid Deployment CardioLog/Power BI


 Follow @cardiolog