

There has been a lot of buzz lately around Power BI. Power BI was released in 2014 and made a huge impact on how Microsoft users view their data. Microsoft branched out from static reports to create highly visual and interactive dashboards that change to reflect real-time data.
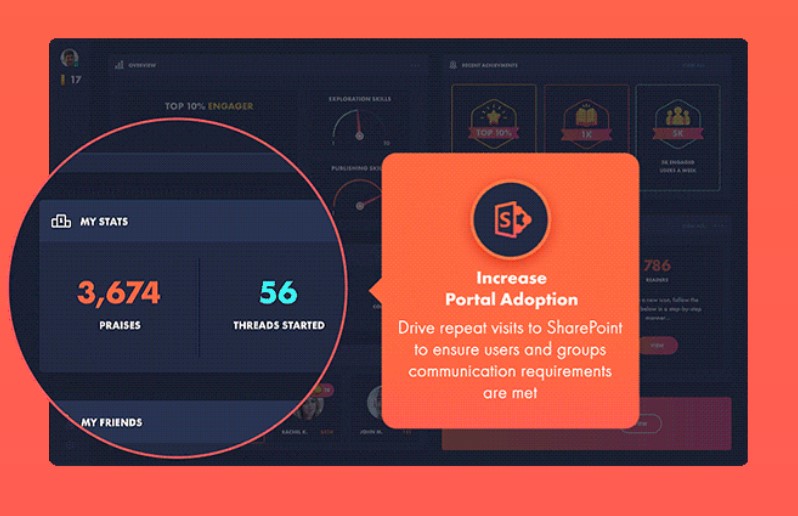
For SharePoint administrators, using Power BI for SharePoint is a game changer. It allows you to track real-time usage of the product to help boost SharePoint adoption. By making the most of Power BI, you can see how your SharePoint portal is being used by your end users and find areas for improvement.
What is Power BI?
Power BI is an analytics tool that helps you visualize your data by creating sleek, customizable reports. It creates live dashboards that you can share with anyone in your organization or embed in your app, website, or SharePoint portal. Power BI can pull data from data sources on-premises or in the cloud. It can take information from services like Excel, social networks, Salesforce, and SharePoint.
What are the Different Power BI Licenses?
Power BI comes has three different licenses.
-
- Power BI Desktop: This version is free through your Microsoft Account. It allows you to pull information from hundreds of data sources both in the cloud and on-premises.
-
- Power BI Pro: This version takes reporting a step further. Power BI Pro allows you to collaborate with any user in your organization on a report and share content inside and outside of your organization. This license is $9.99 per user per month.
- Power BI Premium: The pricing for Premium is calculated per node per month plus the $9.99 Power BI Pro licenses for every user. Power BI Premium lets you share data with any user, even ones not in your organization, without buying a per-user license. Premium allows larger enterprises to scale up and view up-to-date data from anywhere with the Power BI Mobile app.
What are the Benefits of Using Power BI?
-
- Power BI Desktop is free. There aren’t any disadvantages of trying Power BI because you can try it free of charge. The free version allows you to create dynamic reports that are easily customizable. You can later decide if you want to upgrade, but the free version should be sufficient for most reports.
-
- The UI is sleek and the reports are interactive. Without any coding or time-consuming efforts, you can create reports using the pre-made visuals or your own customized visuals. The dynamic feature of the reports makes it even easier to analyze your data. Since Power BI integrates to your data sources, like SharePoint, when information changes, the report automatically updates to show that real-time data.
-
- The reports are easy to customize. You can quickly change the entire look and feel of your report without any coding. You can add or remove data, change visualizations (for example, you can change a graph to a chart to a map), and apply more filters to get even more detailed insights.
- There are hundreds of data sources that Power BI can use to gather information. Some of the available on-premises and cloud-based services are Salesforce, Excel, SharePoint, and Dynamics 365. With automated refreshed, Power BI always pulls the latest information from these sources.

What are the Disadvantages of Using Power BI?
-
- If you want to filter by user information, you can only filter by location, company, and department, which are from the Azure Active Directory. If you want to filter by anything else, you need to take some time to customize them.
-
- Currently, Power BI reports only include activity from SharePoint team sites and group sites. If you want to learn how your employees are interacting on discussion boards or what is contained in their SharePoint lists, you are not able to.
-
- In addition to the point above, the SharePoint metrics that are tracked are restricted to activity with files. So again, you would not be able to track SharePoint discussion boards, which would provide you with a strong understanding of your employees’ thoughts and opinions.
-
- A lot of the metrics are pre-aggregated so customizations can be limited.
- Power BI can only access up to 12 months of data from the current month. This makes it more difficult to see your yearly changes and improvements, as that data is only available for a limited amount of time. Additionally, the data on user-specific activity is only available for the last month so you could be missing out on even more valuable insights on user performance.
What are the Benefits of Power BI for SharePoint?
With SharePoint, some of the top metrics to track are adoption and engagement. With Power BI’s Office 365 adoption content pack, it’s easy to find out the exact information you’re looking for. You can see how many of your users have adopted Office 365, including the number of new users vs returning users. Being able to measure this gives you a clear understanding of your ROI on SharePoint or Office 365. If you see that a large portion of users are not using SharePoint, you may need to organize a training day or a session with SharePoint power users to get lagging users excited about the portal. You can also filter the usage information by properties from the Azure Active Directory, including region and department. This allows you to even further refine your training and only host training days for lagging departments. This saves you time and money on training users who are already consistently using SharePoint. You can also use this information to create surveys specifically for inactive users to find out why they’re not as involved in the portal. On the other hand, you can use this information to ask the most active users how they use the portal to learn from their success as well as have them promote the portal within their team.
How to Use Power BI for SharePoint:
-
- Install Power BI Desktop and sign in with your Office 365 credentials
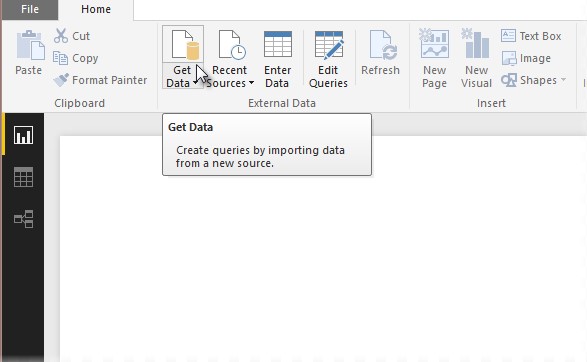
- After opening Power BI, click on “Get Data” to import information from SharePoint.
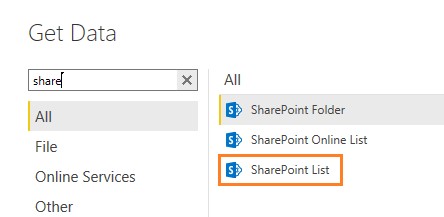
- Click on “More…” in the dropdown menu and search for SharePoint. Three SharePoint data sources will show up: Folders, Online Lists, and normal lists. After choosing one, you will put in your SharePoint URL.
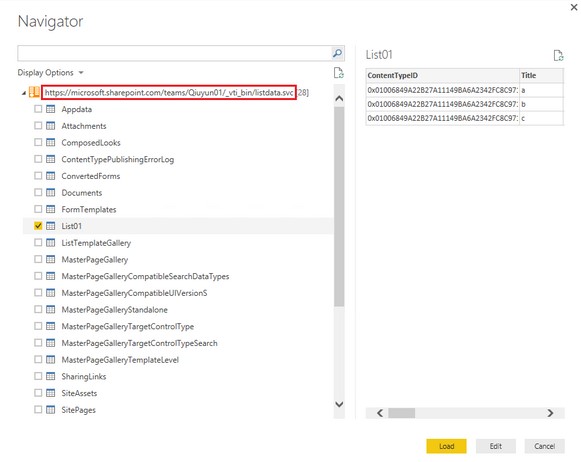
- Next, you’ll choose a folder or list and then click “Load”.
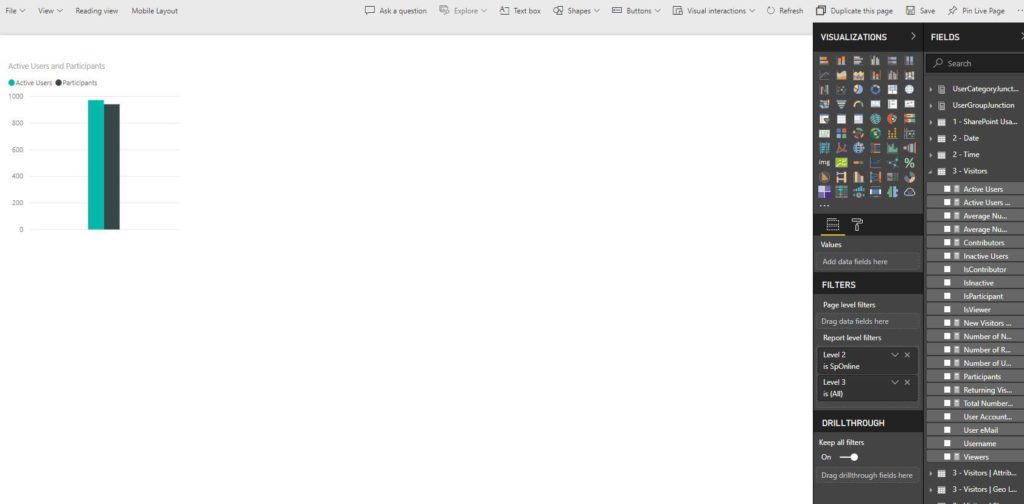
- Now you can start designing your report. You can pick and choose from any of the visualizations available in Power BI, such as bar charts, line charts, map, scatter chart, and pie chart.
- After finishing your report, you can click on “Publish” to publish the report to Power BI Online. You’ll be asked to choose where to publish the report: in your workspace or in your Office group workspaces.
- A vital step after publishing any report is to schedule its data refresh. Under Schedule Refresh, you can add in how often you want the data to refresh as well as the times when it should refresh (you can add more than one).
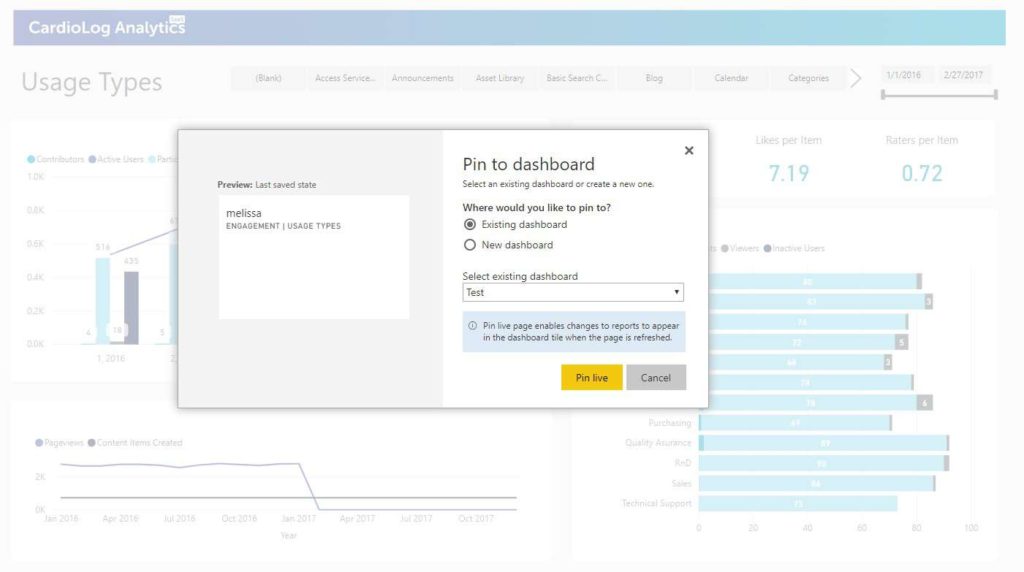
- Turning your report into a dashboard is very simple. All you have to do is go to your report and click on “Pin Live page” on the top. Then, Power BI will ask you to choose which dashboard you want your report on, whether it’s an existing dashboard or a brand new one.
- Now that you’ve created your dashboard, let’s share it. Under your report’s File menu, click on “Publish to web”. Power BI will provide you with the embedded code that you can paste into your blog or website as well as a URL that you can quickly email to your colleagues.
Power BI also gives you a few other sharing options for your report. Besides publishing to the web, you can also embed the report in a website or portal, embed the report in SharePoint Online, export it to PowerPoint or export it to the Power BI Desktop.
Using Power BI for your SharePoint portal can help you to boost user adoption and engagement. It gives you the ability to measure and analyze your employees’ actions in SharePoint to discover who are your top users and who needs more support and training. However, there are still some aspects of Power BI Reporting that are limited. If you’re looking for more in-depth reports that can show you more long-term data, you might want to look into a third-party analytics solution, such as CardioLog Analytics. CardioLog Analytics delivers deep insights into the performance of portal, web, and social platform enabling organizations to optimize their portal’s impact and maximize their return on investment.


 Follow @cardiolog