

A company’s intranet portal is directly correlated with revenue in today’s digital marketplace, making companies bend over backward to understand analytics and optimize their portals. Intranet reporting was once the poor cousin of website analytics, but today it is a critical element of any large organization’s digital workplace strategy that you need to understand.
This user guide is designed to give you a picture of the intranet analytics landscape before you make a decision on the option that best suits your organization.
Note: This article will focus more on SharePoint and SharePoint Online / Office 365 ahead of other intranets as SharePoint is preferred by 80% of fortune 100 companies. Note that the logic behind intranet reporting or analytics still applies, whether your company uses SharePoint or any other solution.
What is an Intranet?
An intranet is a browser-based collaboration and content management system. It acts as a platform used to create websites, where users can store, organize, share, and access information, documents, and content from any device via web browser. The overall function of an intranet is to store the company’s resources and information in a secure and centralized location, where employees can easily access it. Information is stored in pages, web-parts, apps, and content types such as lists, libraries, documents, calendar, contact, and appointment.
Why is Intranet Reporting Important?
Poorly managed intranet sites cost companies millions in lost productivity and this fact alone means that it’s of critical importance to get the best out of your company’s intranet site. Nielsen Norman Group once reported that the cost of lost productivity for a company with 10,000 intranet users can be $15 million per year for companies with low usability intranet sites (among the worst 25%) compared with the companies in the top 25%.
Several aspects of your company’s intranet portal can be enhanced with analytics and intranet reporting tools:
- User Adoption
- User Engagement
- Collaboration
- Knowledge management
- Communication
- Productivity

The common route companies take when it comes to maintaining an optimal intranet portal is by using analytics as a way to monitor, control and manage activity within the portal. Analytics tools collect and organize data that reflects activity taking place within the portal.
Data provides insights that point directly to problem areas within the portal. Analytics tools can increase productivity, engagement, and adoption all in one by identifying areas of an intranet that are causing problems. Issues like common failed searches, pages that aren’t being viewed and documents that aren’t being downloaded can all be identified quickly. Once they’re isolated, actions can be taken towards improving the issue, changing the processes or moving the content to promote greater interaction and help organizations made data-informed decisions.
Free Intranet Analytics Options
When it comes to Analytics tools, there are multiple options available. Platforms such as SharePoint and Microsoft Office 365 provide their users with a few complementary “Out of the Box” analytics tools.
Google Analytics (GA) is the most commonly used analytics software, it connects to intranets from several platforms and ultimately it provides free analytics tools.
While the Google Analytics tools are free to use, their metrics were originally developed to provide analytics for websites so there are a number of pros and cons you need to consider before progressing down this path.
The Pros of Using Google Analytics for Intranet
- Google Analytics is free to use
GA is free to use, this makes it a standout option for price-sensitive organizations.
- Quick Setup and Ease of Use
GA is quick to install with on page code snippets (see installation guide below) and relatively simple to use for understanding key elements like page views and site usage.
- Basic Intranet Reporting Functionality
GA is built to allow customizable views or dashboards and reporting can be customized to include key metrics over relevant periods.
The Cons of Using GA for Intranet
- GA is not built for intranets
Google Analytics is focused towards advertisers and marketers. Original iterations of the product were more intranet friendly, however, GA is becoming more and more focused on advertising with new features aligned with integrating to Adwords and conversions.
- GA cannot track individual users
GA reports will not show individual visitor details which is a major drawback for analyzing your intranet site usage by department or tracking who has downloaded certain documents. Information like tracked logins, pages accessed, documents opened/downloaded, IP addresses, usernames and many more vital pieces of information are not trackable.
- Not Built for Document Tracking
Company documentation is all stored on the company’s intranet site, but tracking opening of these documents in GA can be tough. To track documents using GA you will need to tag document links with JavaScript snippets. These tags allow you to monitor access to the document, however, you cannot track opens with a direct URL link.
If you pause to think for a moment about how your company intranet is set up, many or most of your company documents are probably accessed through a direct URL. GA won’t give an accurate count of how and when your documents are accessed through these clicks and this is a major drawback for big companies.
- Security Issues
If you use GA to report and monitor your intranet usage, a wealth of information will be sent to Google’s data collection servers when a page is viewed. Sensitive information that can be intercepted by hackers or attackers includes IP addresses, server names, file paths and other sensitive data that most companies go to great lengths to protect.
Related Topics:
- Boost Your Intranet Portal with Actionable Insights and Intranet Analytics
- Best Employee Intranet Software
- Intranet Communications – Driving Staff Communication and Collaboration

How to Install Google Analytics for Intranet
Installing GA onto your intranet site is the same as setting it up for a website. It’s a 5-minute task for your IT department, but if you’re doing it yourself, here is a quick guide.
1.) Sign up for a free GA account
If you don’t have an account already you can create one here https://www.google.com.au/analytics/. If you already have analytics setup for your website, you simply need to add another property
2.) Copy your tracking code and add it to the header section of your site
![]()
On-Premises Analytics for Intranet Sites
When analytics tools are On-Premise it means that the software is physically located in an enterprise’s office on their servers. Enterprises may prefer On-premise solutions for several reasons:
Safety
With on-premise analytics, the enterprise has full control over who can access the systems and the data. Enterprises that need to ensure the highest level of safety for their data, such as governments and law firms, often prefer the usage of on-premise analytics.
Customization
On-premises software is also easier to customize. Whereas cloud-based software can be difficult for integration with other applications, on-premises solutions allow users to customize certain elements of the software based on the licensing. The freedom to customize gives more leeway when it comes to tailoring your software to your organization’s needs.
Dedicated IT Staff for Maintenance
With on-premises software, a dedicated IT staff member is needed for constant upkeep of the server for maintenance and support. This provides a company with greater accessibility and support with an in-house staff member that is available to answer requests.
Cost Effectiveness
Although On-premises analytics software is more expensive, it actually is more cost-effective in the long run. An enterprise buys and owns the on-premises software. With Saas Solutions, an enterprise is paying application, hosting, transaction, and license fees.
SharePoint Out of the Box Analytics
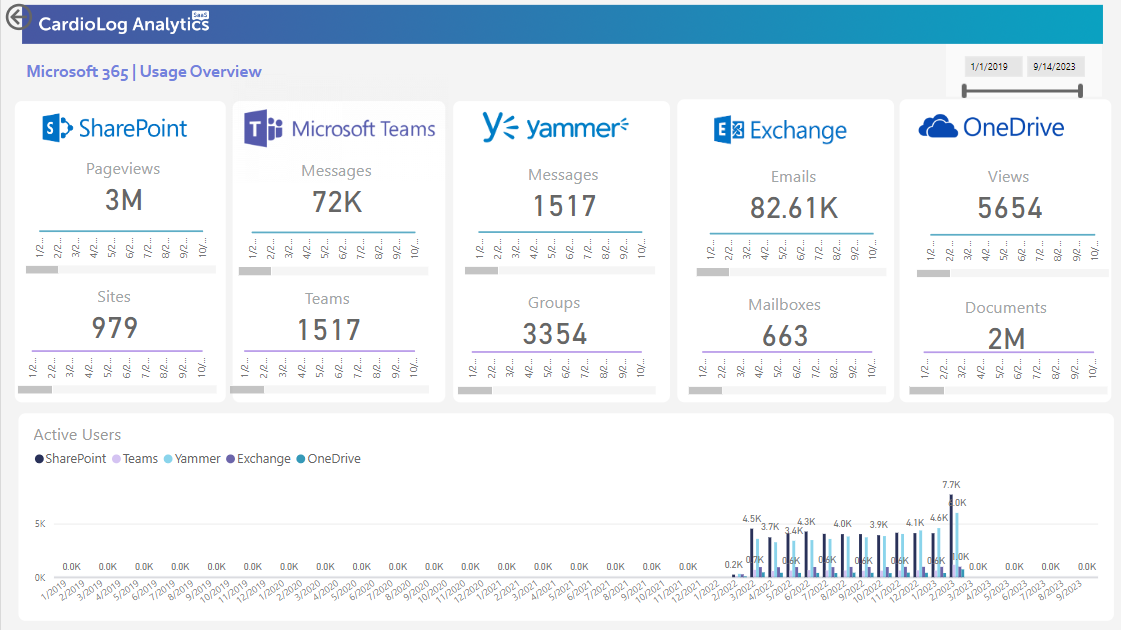
SharePoint is the most popular enterprise-level document collaboration platform. It has over 190 million users across 200,000 customer organizations. SharePoint has a range of out-of-the-box analytics that is a great starting point if your organization wants to attain an overview of what’s happening in your portal and across the greater Office 365 platform. The Office 365 Adoption Content Pack allows administrators to further visualize and analyze their Office 365 usage data, create custom reports, share insights, and understand how specific regions or departments use Office 365. The Office 365 content pack offers some useful SharePoint information including User Count, Activity, Storage, and Content.
SharePoint OOTB Advantages
The Adoption Content Pack/SharePoint’s out-of-the-box analytics provide an overview of which Office 365 services are used and allow for a usage comparison of different Office 365 services to one another. They also show regional/departmental usage and how licenses are utilized and optimized. In addition, they utilize the Power BI visualization and report editing capabilities, and easily allow users to share reports within the Power BI interface.
SharePoint OOTB Limitations
The Adoption Content Pack offers some valuable insights on general trends occurring with SharePoint/Office 365, but has limitations if your organization would like to have an in-depth understanding of usage trends. Some of the main limitations include:
- Most metrics are pre-aggregated, and drill-down abilities are limited
- Up to 12 months of historical data, through the current month
- User-specific activity is limited to last month
- SharePoint metrics are limited only to actions on files
- The current version of the content pack includes activity only from SharePoint team sites and group sites
- Filtering by user information is limited to Location, Company, and Department attributes coming from Azure AD (using additional attributes requires customization)
Reports can be viewed for a single Office 365 subscription at a time

Alternatives to SharePoint’s Out-of-the-box Analytics
Organizations that are looking to gain a deep understanding of their SharePoint usage often utilize third-party analytics tools that are tailor-built for SharePoint. Though these intranet analytics tools do come at a cost, they offer a wider range of metrics that provide more detail and insight.
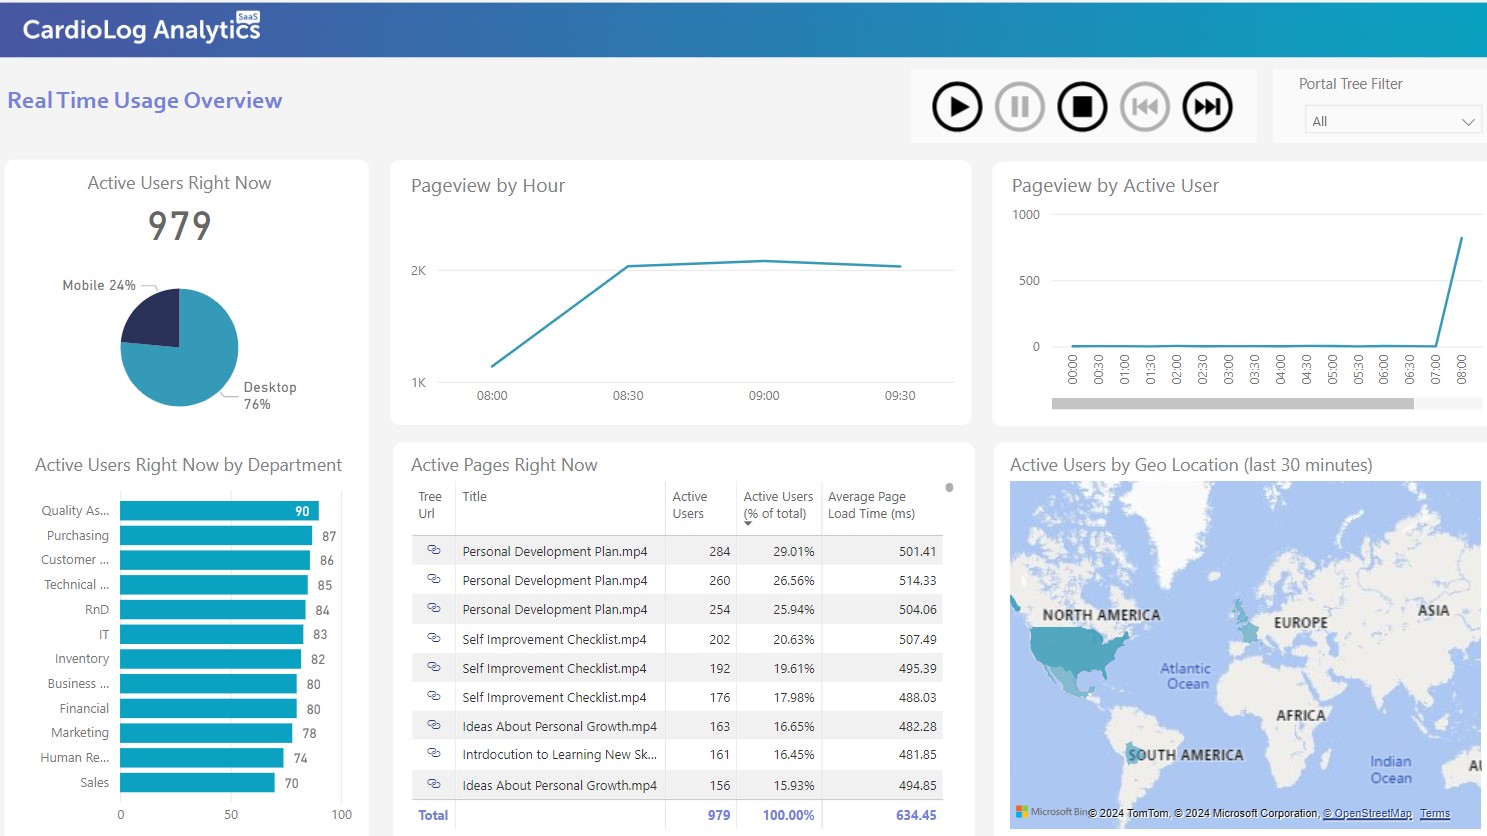
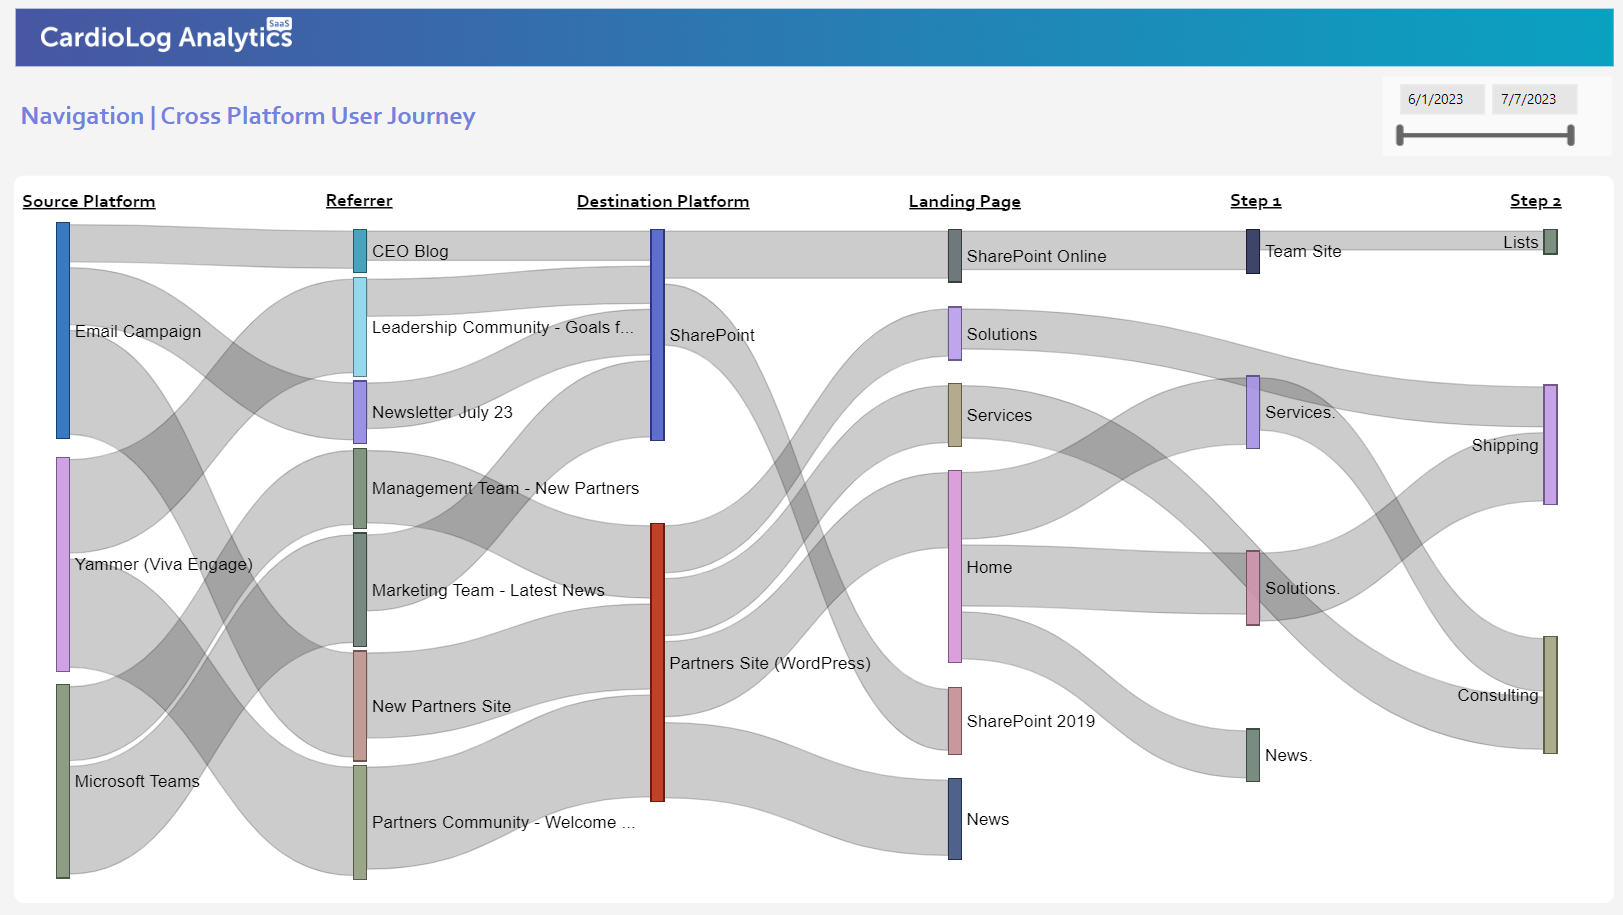
CardioLog Analytics is an example of a third-party analytics solution, made to fit SharePoint and Office 365 intranet portals, that has the ability to drill down into a wide range of metrics that track activity down to the unique user level. Medium-sized to enterprise-level companies are investing in third-party tools in order to fully optimize their intranet site and ultimately save money by driving greater productivity and ease of collaboration.
Intranet Analytics Best Practices
When large enterprise organizations intend to invest in SharePoint/the greater Office 365 platform, good intent is simply not enough. A successful portal needs constant upkeep and measurement to make sure that it is functioning as a collaborative space for employees. When technology platforms and the value they provide are neglected, both the employee user experience and business productivity suffer.
Even though analytics should be at the core of any enterprise platform’s strategy, many organizations struggle to measure and claim intranet success. Some best practice tips that can be turned into action:
Create an Intranet steering committee
By creating a steering committee dedicated to the success of the Intranet, your likelihood of accountability and Intranet success is much greater. By working the success of the Intranet portal into a regular process, you’ll be able to review your metrics and then use these insights to take appropriate actions. By gathering your stakeholders and experts on a quarterly or monthly basis, actions needed to ensure the success of the intranet are more likely to get done.
Take a step back
One report on one particular site or subsite doesn’t give you a full picture of how your intranet is performing. If you’re in charge of maintaining the usage of the entire intranet as a whole or need to provide reports to management on the Portal’s usage levels, you can generate Usage Reports to show data that reflects usage of the entire SharePoint 2013 farm, as well as an Entire SharePoint Online tenant. Visualizing usage from a holistic level will help you to understand usage trends more thoroughly as you drill down into various aspects of the portal.
Measure Before and After
Metrics are vital for showing the progress of a project and whether it’s improved, stagnated or declined. With any intranet, it’s just as important to measure before any major changes have taken place. For example, if your organization is about to embark on a Migration journey, it’s recommended that you begin measuring your portal before the migration, to assess the current usage and collaboration levels. Measuring during the Migration, and after are just as important if you would like to compare your activity and set benchmarks for success.
Collect stories and feedback
Gathering analytics is a powerful method for understanding trends within the Intranet portal, but most often they only tell part of the story. To be able to paint the Intranet in full picture, the need for human insights is obvious. Capturing user feedback via powerful engagement tools is an easy win when it comes to filling the analytics gap. Users can create campaigns to target specific users or groups within the intranet, with the right content at the right time.
Intranet Usage Statistics and KPIs
Organizations that set KPIs (Key performance indicators) are able to create key benchmarks to analyze their success and failures, versus those that simply take the advanced analytics plunge with no foresight of what kind of strategy they’d like to put in place. When faced with the question of “Is my Intranet performing as expected and producing a return on investment” or even, “Was my migration successful?”, organizations may have difficulty determining these answers without a clear strategy with measurable KPIs.
It’s also important to take into consideration that the KPIs for your organization may vastly differ from the KPIs of another. This depends entirely on the goals that you’ve set forth in terms of how you’d like your users to utilize your intranet. For example, if the main purpose of your intranet is for it to be a quick place for users to go in, get the information they need, and get out quickly, your KPIs for time spent on the page may be much less than those of an organization who would like their users to spend large amounts of their days in the intranet, gathering and documenting information.
Here are a few examples of Organizational Intranet KPIs:
- 90% of End-Users have migrated to the new portal by July 2018
- 3,000 page views per week per department to be achieved
- 90% of end-users active on social platforms like Yammer, Sitrion, or SharePoint Social
Closing the Loop
Creating an analytics culture is challenging for many organizations across the board. Understanding what to measure, as well as the right tools is no easy feat. Yet, with the right intentions and a vision, the possibilities for creating a full-scale digital workplace can be realized. Investing in Intranet Analytics and Engagement tools is a powerful step in the direction of reclaiming the Intranet Portal and building it out to be not just a document management platform, but a place for full-scale enterprise collaboration.
*CardioLog Analytics offers advanced on-premise and SaaS SharePoint analytics solutions that are designed for businesses of all sizes. If you’re interested in optimizing your SharePoint portal, contact us to speak to one of our friendly team or find out more information about CardioLog Analytics.


 Follow @cardiolog