

As 2024 begins, we are all looking ahead to make the best of this upcoming year. As we all set our New Year’s resolutions to get into shape for 2024, why not apply the same notion to your SharePoint portal? Get your SharePoint portal into the best shape possible by focusing on these 5 basic analytic categories that will help you optimize your portal and increase user adoption.
Visitor Reports
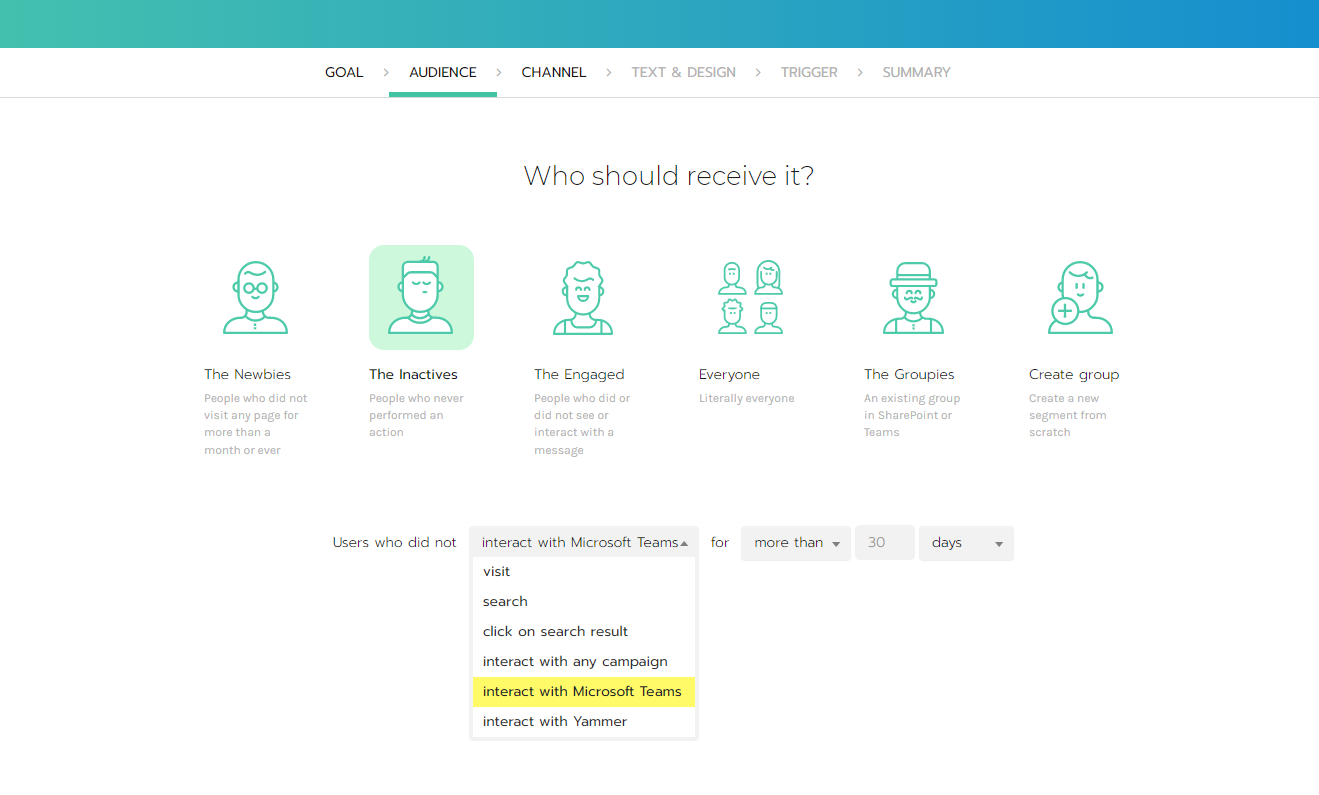
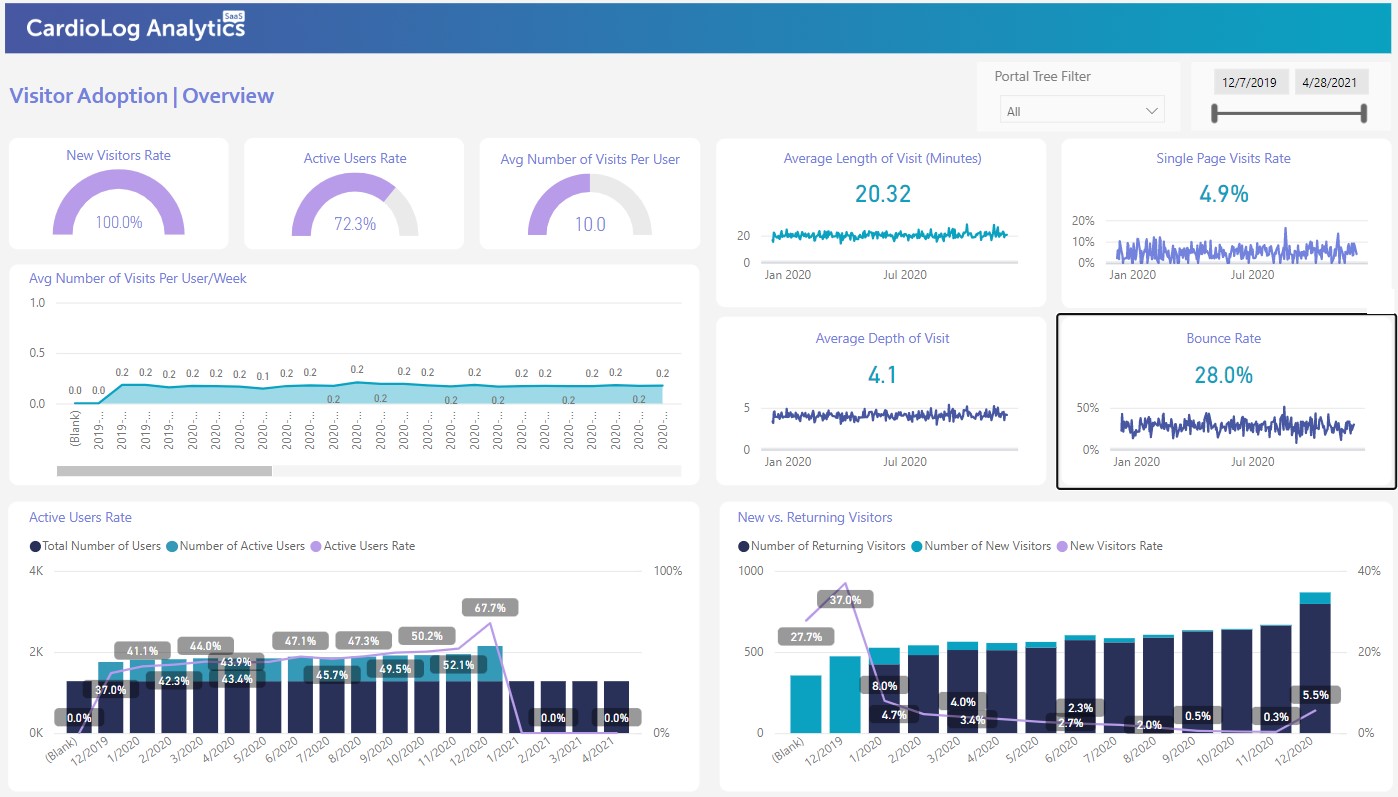
Who’s who in your SharePoint platform? Find out who your key users are on various sites/blogs/discussions with visitor reports. If you’re going to make important business decisions related to your portal, it’s necessary to know who and how your portal is being accessed. Use an advanced analytics solution to measure key metrics like average visits per user, loyalty, average number of visitors, and more.
Social Reports
Social is all the rage. Organizations and companies are starting to realize not just the value, but the necessity of encouraging social collaboration within their portals. Social analytics can empower you to take control of your social solution by highlighting which social avenues have traffic, and which ones need a little more attention. You can even track which users in the portal are gaining traction, likes, comments, and praises, and which users need a bit of a social push.
Content Reports
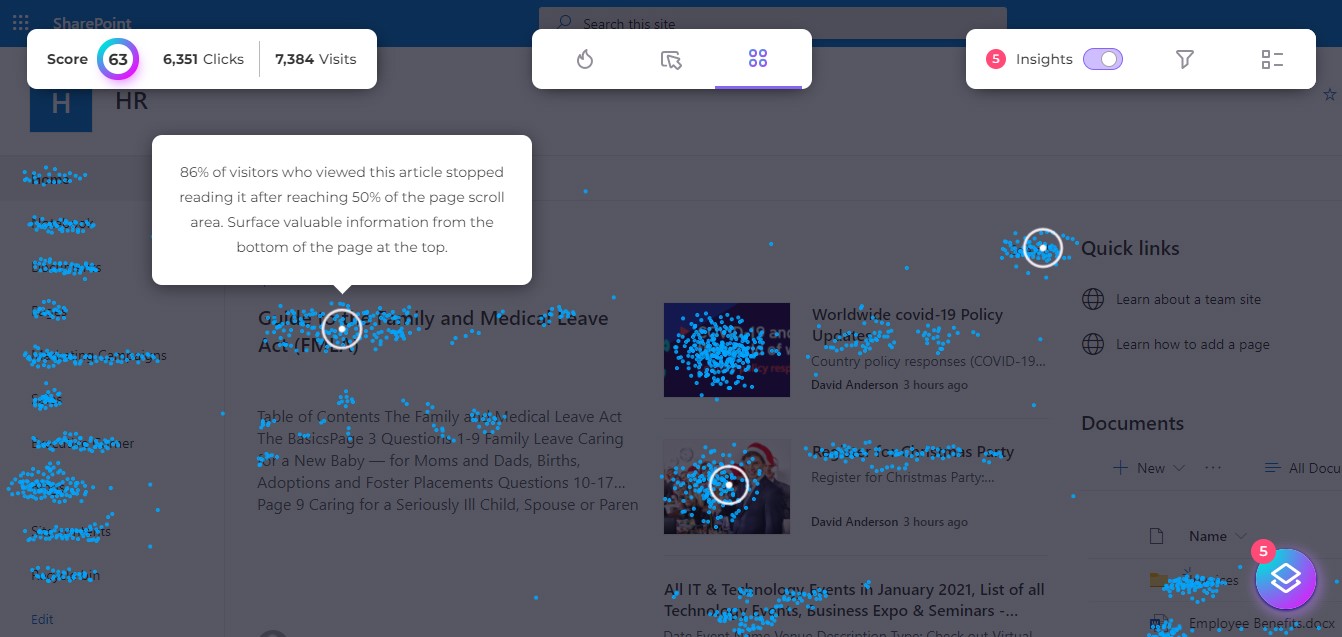
Content is key. You’ve probably heard it before, and we’ll say it again. By producing engaging content, your users are more likely to access and return to your portal. One piece of quality content can catalyze a user’s experience, thus motivating them to return to the portal regularly. If the best-performing content is an audio file, video, visual, or document, an analytics solution is there to first inform you, so you can then make informed decisions on how to optimize your content. Is the content being accessed by the users who would potentially gain the most from the information? Dig deep into your content’s performance with analytics, and you can transform your portal with data-driven insights.
Search Reports
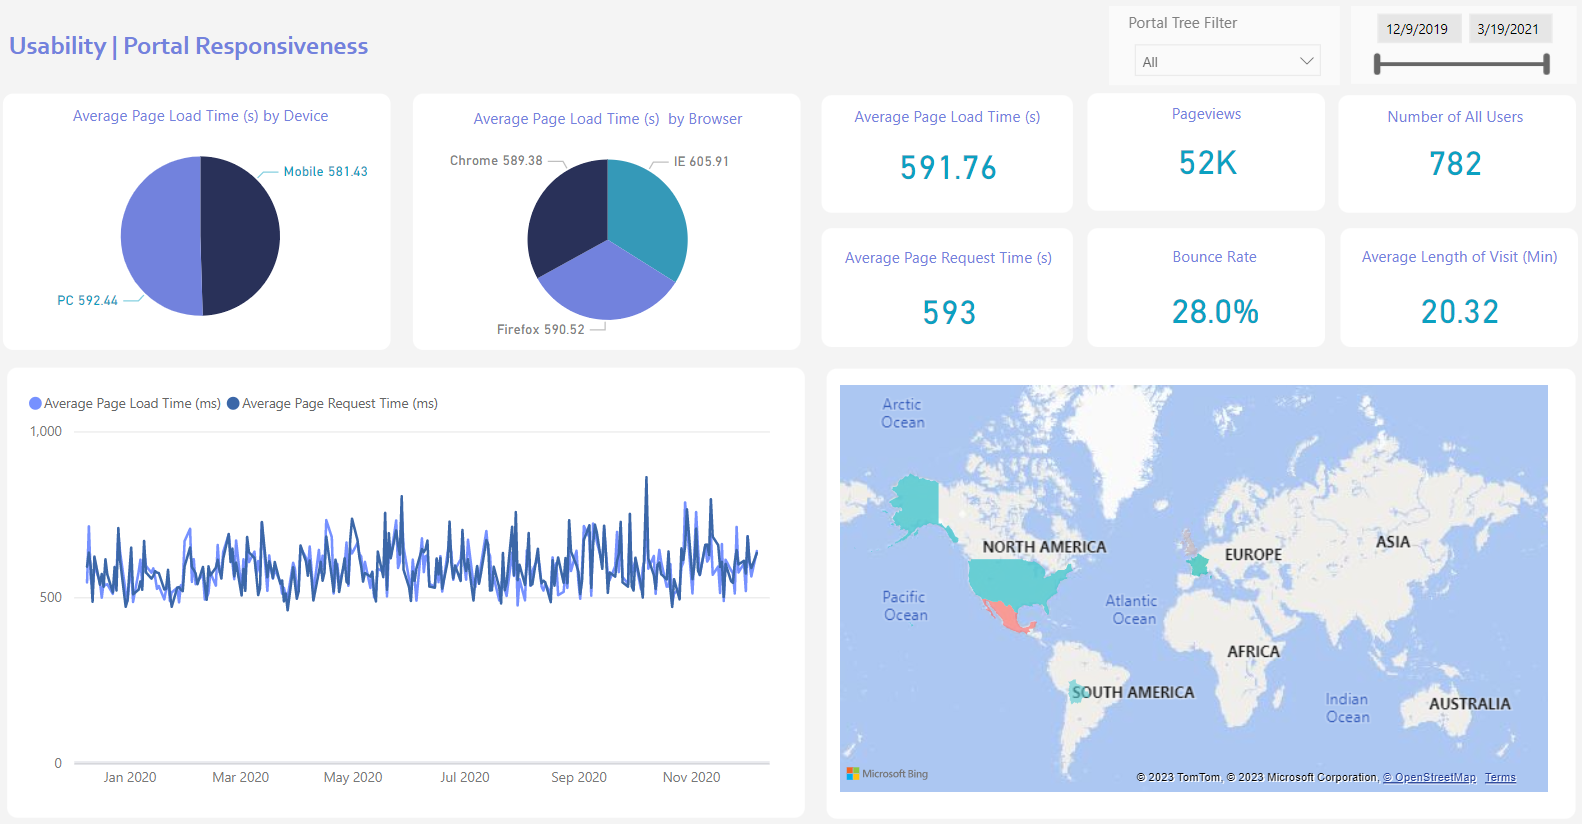
Your search options with your SharePoint portal are vast and dynamic, but how do you know your users are getting what they need when they utilize the search function? How can an analytics solution help you in making sure your portal search investment is realized? It’s vital to know whether your search solution is doing its job. You can track which search phrases are dominating your portal with the click of a mouse. Furthermore, you can track the average onsite visitors per visit, which helps you to understand how accessible the content is and whether the content titles are appropriately matching your end users’ searches.
Navigation Reports
Navigation reports enable you to monitor user navigation paths from each and every angle: What referred them to the site? How did they get there? What exact path did they take? What page did they land on and what page did they exit from? Discover what sites users are visiting and what content they are navigating to when on those sites. You can even find out when and where users and exiting and entering the SharePoint portal.


 Follow @cardiolog