

Your organization has taken its SharePoint Analytics and Reporting initiatives by the reigns. You may have assigned a steering team to create an organized plan for how to tackle challenges in the SharePoint portal, as well as use SharePoint Analytics to solve these issues and improve the portal. As a business user, you’ve become familiar with the standard reports included in CardioLog Analytics, such as page views, search reports, time on site, portal visitors, and more. Yet, the sheer amount of activity going on in your portal that would you like to further track leaves something to be desired.
The team of developers at CardioLog Analytics have been working hard to meet these needs, and have come up with an enhanced API solution to assist you in making your portal monitoring experience as seamless and flexible as possible. If you’re looking to expand your SharePoint reporting in an advanced way, the various offerings for CardioLog Analytics are guaranteed to suit your needs.
With the CardioLog Advanced Features you can:
- Create custom events and build custom SharePoint reports using the CardioLog SDK.
- Track visitor interactions with the browser such as clicks on a button or a banner, filling out form fields, playing videos and more, using our Extended Tracking API.
- Monitor internal E-mail campaigns.
- Build applications to request data from the CardioLog SharePoint reporting engine using the Data Export feature, refine the results, display them anywhere you would like and brand your data with your organization’s colors and logos.
- Monitor any environment you’d like using the Custom Adapter
- Track visitor actions for non-browser apps, such as mobile and tablet apps
- Filter reports using data gathered by the User Categorization feature
1.) Custom SharePoint Reports
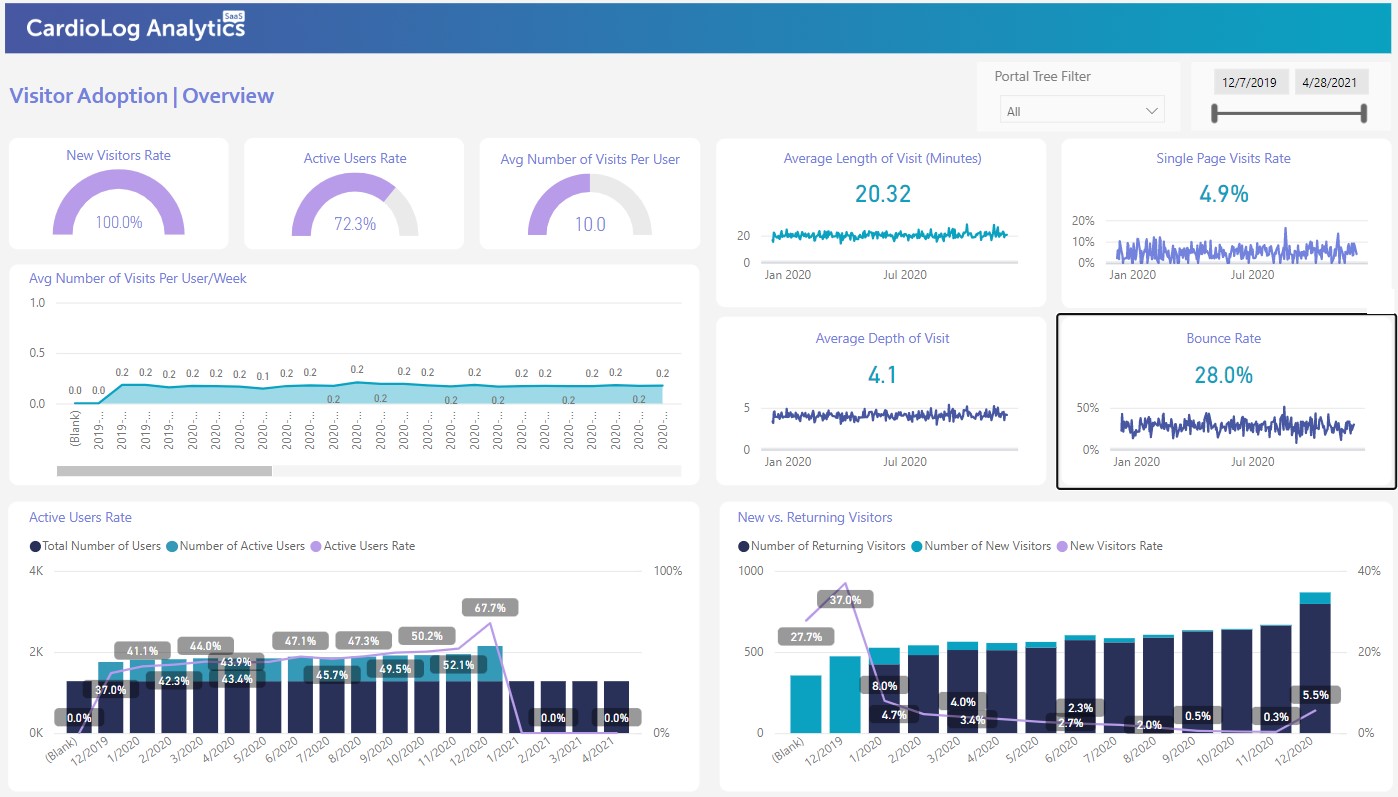
Using the Software Development Kit (SDK), you can create your own customized SharePoint reports to give you additional insights into your portal.. CardioLog Analytics already has many reports in its standard offering, but if you want to produce any other advanced reports you can create them with the SDK. If you combine extended tracking, you can then use custom reports to produce reports based upon banner clicks, videos played, and more.
Say your organization wants to track and create SharePoint video reports, since you’ve noticed that many people are now interacting and watching videos in the portal. You can utilize the extended tracking capabilities to track the percentage of the video that users watched. Then you can take that data and create custom SharePoint reports based upon it with the SDK.
2.) Extended Tracking
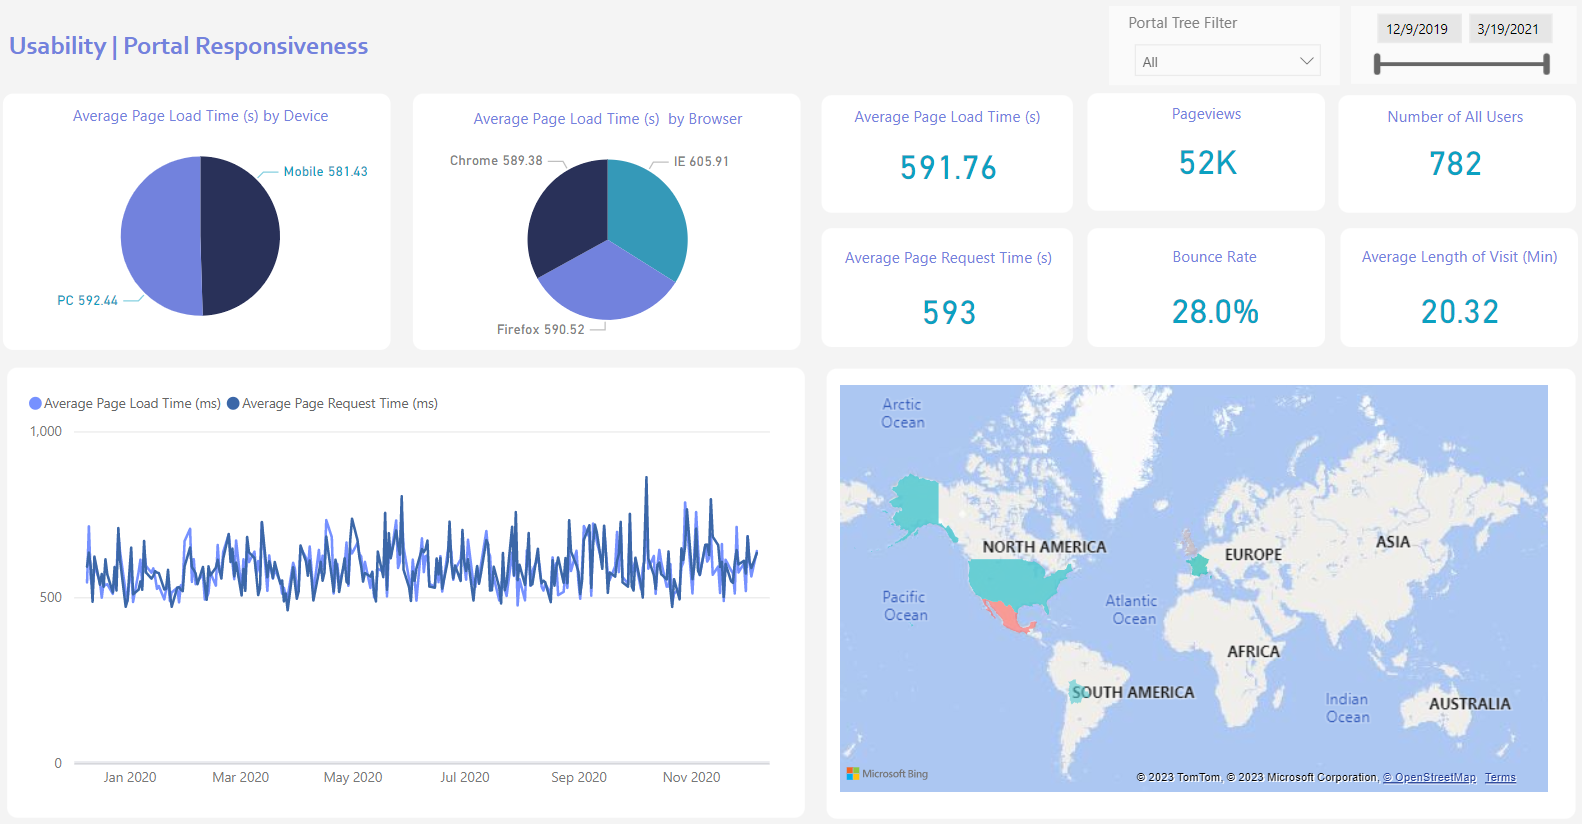
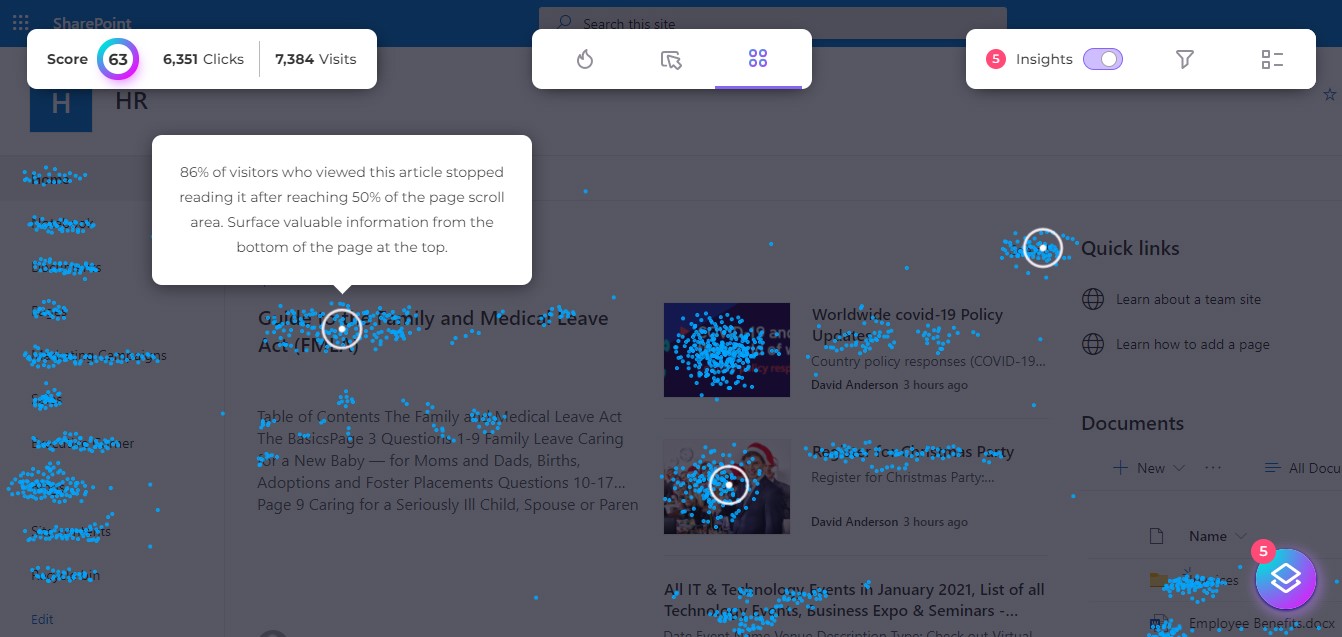
Tracking the amount of users visiting a page, and the length of time they spend there is vital for understanding the basic user navigation paths within the portal. But what about all the interactions going on within the page? Your SharePoint portal can be similarly compared to an online ecosystem. The way in which users are interacting within the sites of the portal is similar to the way that animals and plants interact within an ecosystem. If a population within the eco-system becomes disrupted, a domino effect can occur and cause disruptions to other organisms. Similarly, if a disruption occurs within pages in the portal, it can inhibit users from navigating to other important aspects of the portal. By tracking clicks on a banner, form fields, videos played, and more can give you indications as to how your users are interacting within your portal ecosystem, and whether changes need to be made. By monitoring in depth interactions with the extended tracking , you can adapt your SharePoint portal strategy to promote interaction and adoption within the portal.
3.) Monitoring Internal Email Campaigns
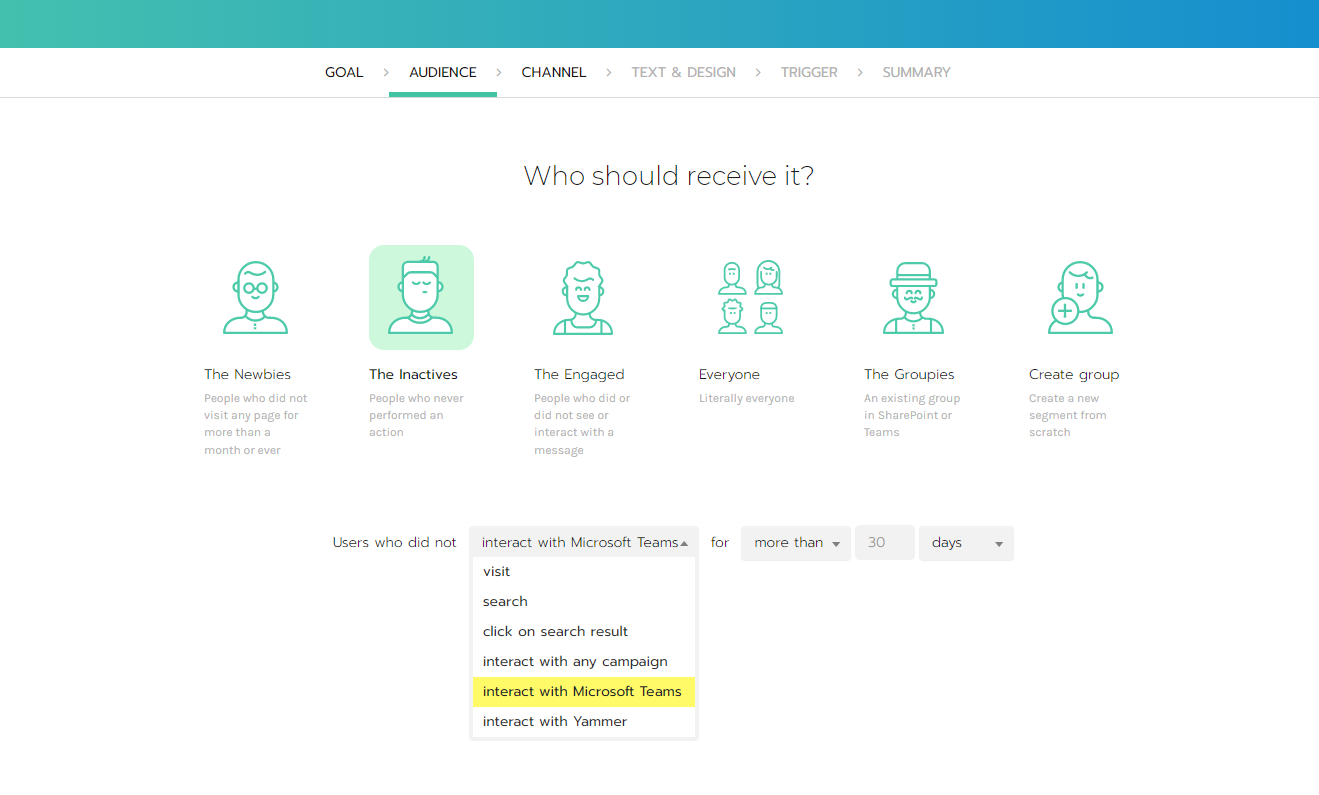
You can utilize the CardioLog Analytics extended tracking feature to also monitor internal email campaigns. When you send out an email to any of your colleagues with a link to newsletter or new website in your portal, you can then check out who of your colleagues has actually clicked on that link, and know whether that campaign was useful. You can then create reports for an email campaign entitled “Internal Traffic sources”. By having this information at hand, you’ll have a clear idea of whether the content within your email campaign was useful and relevant to your employees. Furthermore, you’ll be able to target employees who didn’t open the emails or click on the links.
4.) Data Export
The CardioLog Analytics Data Export feature enables you to expand your CardioLog SharePoint reports in exciting and new ways. You can use the feature to retrieve data and then utilize it within other applications. These exciting features include:
- Impressive flexibility- If you’re looking to achieve a higher level of flexibility and customization for your CardioLog reports, the data export option is for you. You can achieve a great deal of freedom over how to display your reports in terms of design, filters, data content, and where the reports are displayed. If you have a specific branding theme you want to keep consistent with your CardioLog SharePoint Reports, you can brand your data with your organizations colors and logos to really take ownership and enhance the user experience.
- Complete accessibility-Did you know you can also integrate your data with other business applications? The data export featureI enables you to integrate CardioLog Analytics from your smartphone, as well as your desktop. Imagine displaying “Quick Links” on a user profile page, with access to content or pages the user used the most. Similar to “recent activity” on LinkedIn or Facebook.
- Intelligent adaptability- Take your CardioLog data and use the export feature to present your statistics in a whole range of other tools, including Excel and other advanced comparison solutions that enable you to visualize your data in the most flexible ways to suit your needs.
5.) Custom Adapter
With the Custom Adapter feature, you can monitor any environment you’d like within a single web analytics user interface, using a single CardioLog Analytics license. Adapters for non-SharePoint environments are also available. For an application that isn’t a traditional website, CardioLog can track the various pages within the application and create a tree structure based upon them. For example, if you would like to track your Customer Relationship Management (CRM) platform, or even your Enterprise Resource Planning software, you can track all of this with the Custom Adapter feature and then create customized tree structures representing the various components within them. The possibilities are endless with the custom adapter feature at your fingertips.
6.) Non-Browser Apps
CardioLog Analytics also employs an feature for tracking non- browser apps, such as mobile apps as well. Ever wonder how your users interact with mobile and tablet apps? Now you can find out. CardioLog aggregates this data in SharePoint reports to display the unique visitors, number of visits, time spent on the app, and more. Thus, anything occurring within the application can trigger an event, and then be sent to CardioLog to be tracked. If you’re looking to track how users are interacting via mobile, the non-browser apps API provides you with deep, data-driven insights so you can take action.
7.) User Categorization
The User Categorization API feature can connect to just about any database you may have. CardioLog’s standard features already allows you to filter SharePoint reports with SharePoint User Profiles or Active Directory User Attributes. With the User Categorization API, you can track any other Human Resource Management Systems such as PeopleSoft or even custom databases. By using the CardioLog user categorization reports, you can dig deep into the databases, displaying information on specific users that otherwise wouldn’t be available. This includes data such as an employee’s ID, department, branch, and other information. CardioLog Analytics can leverage information to filter reports based on department, branch, and region as well.


 Follow @cardiolog